Can AI Really Do Quantitative Research?
This isn't hype, it's fact.
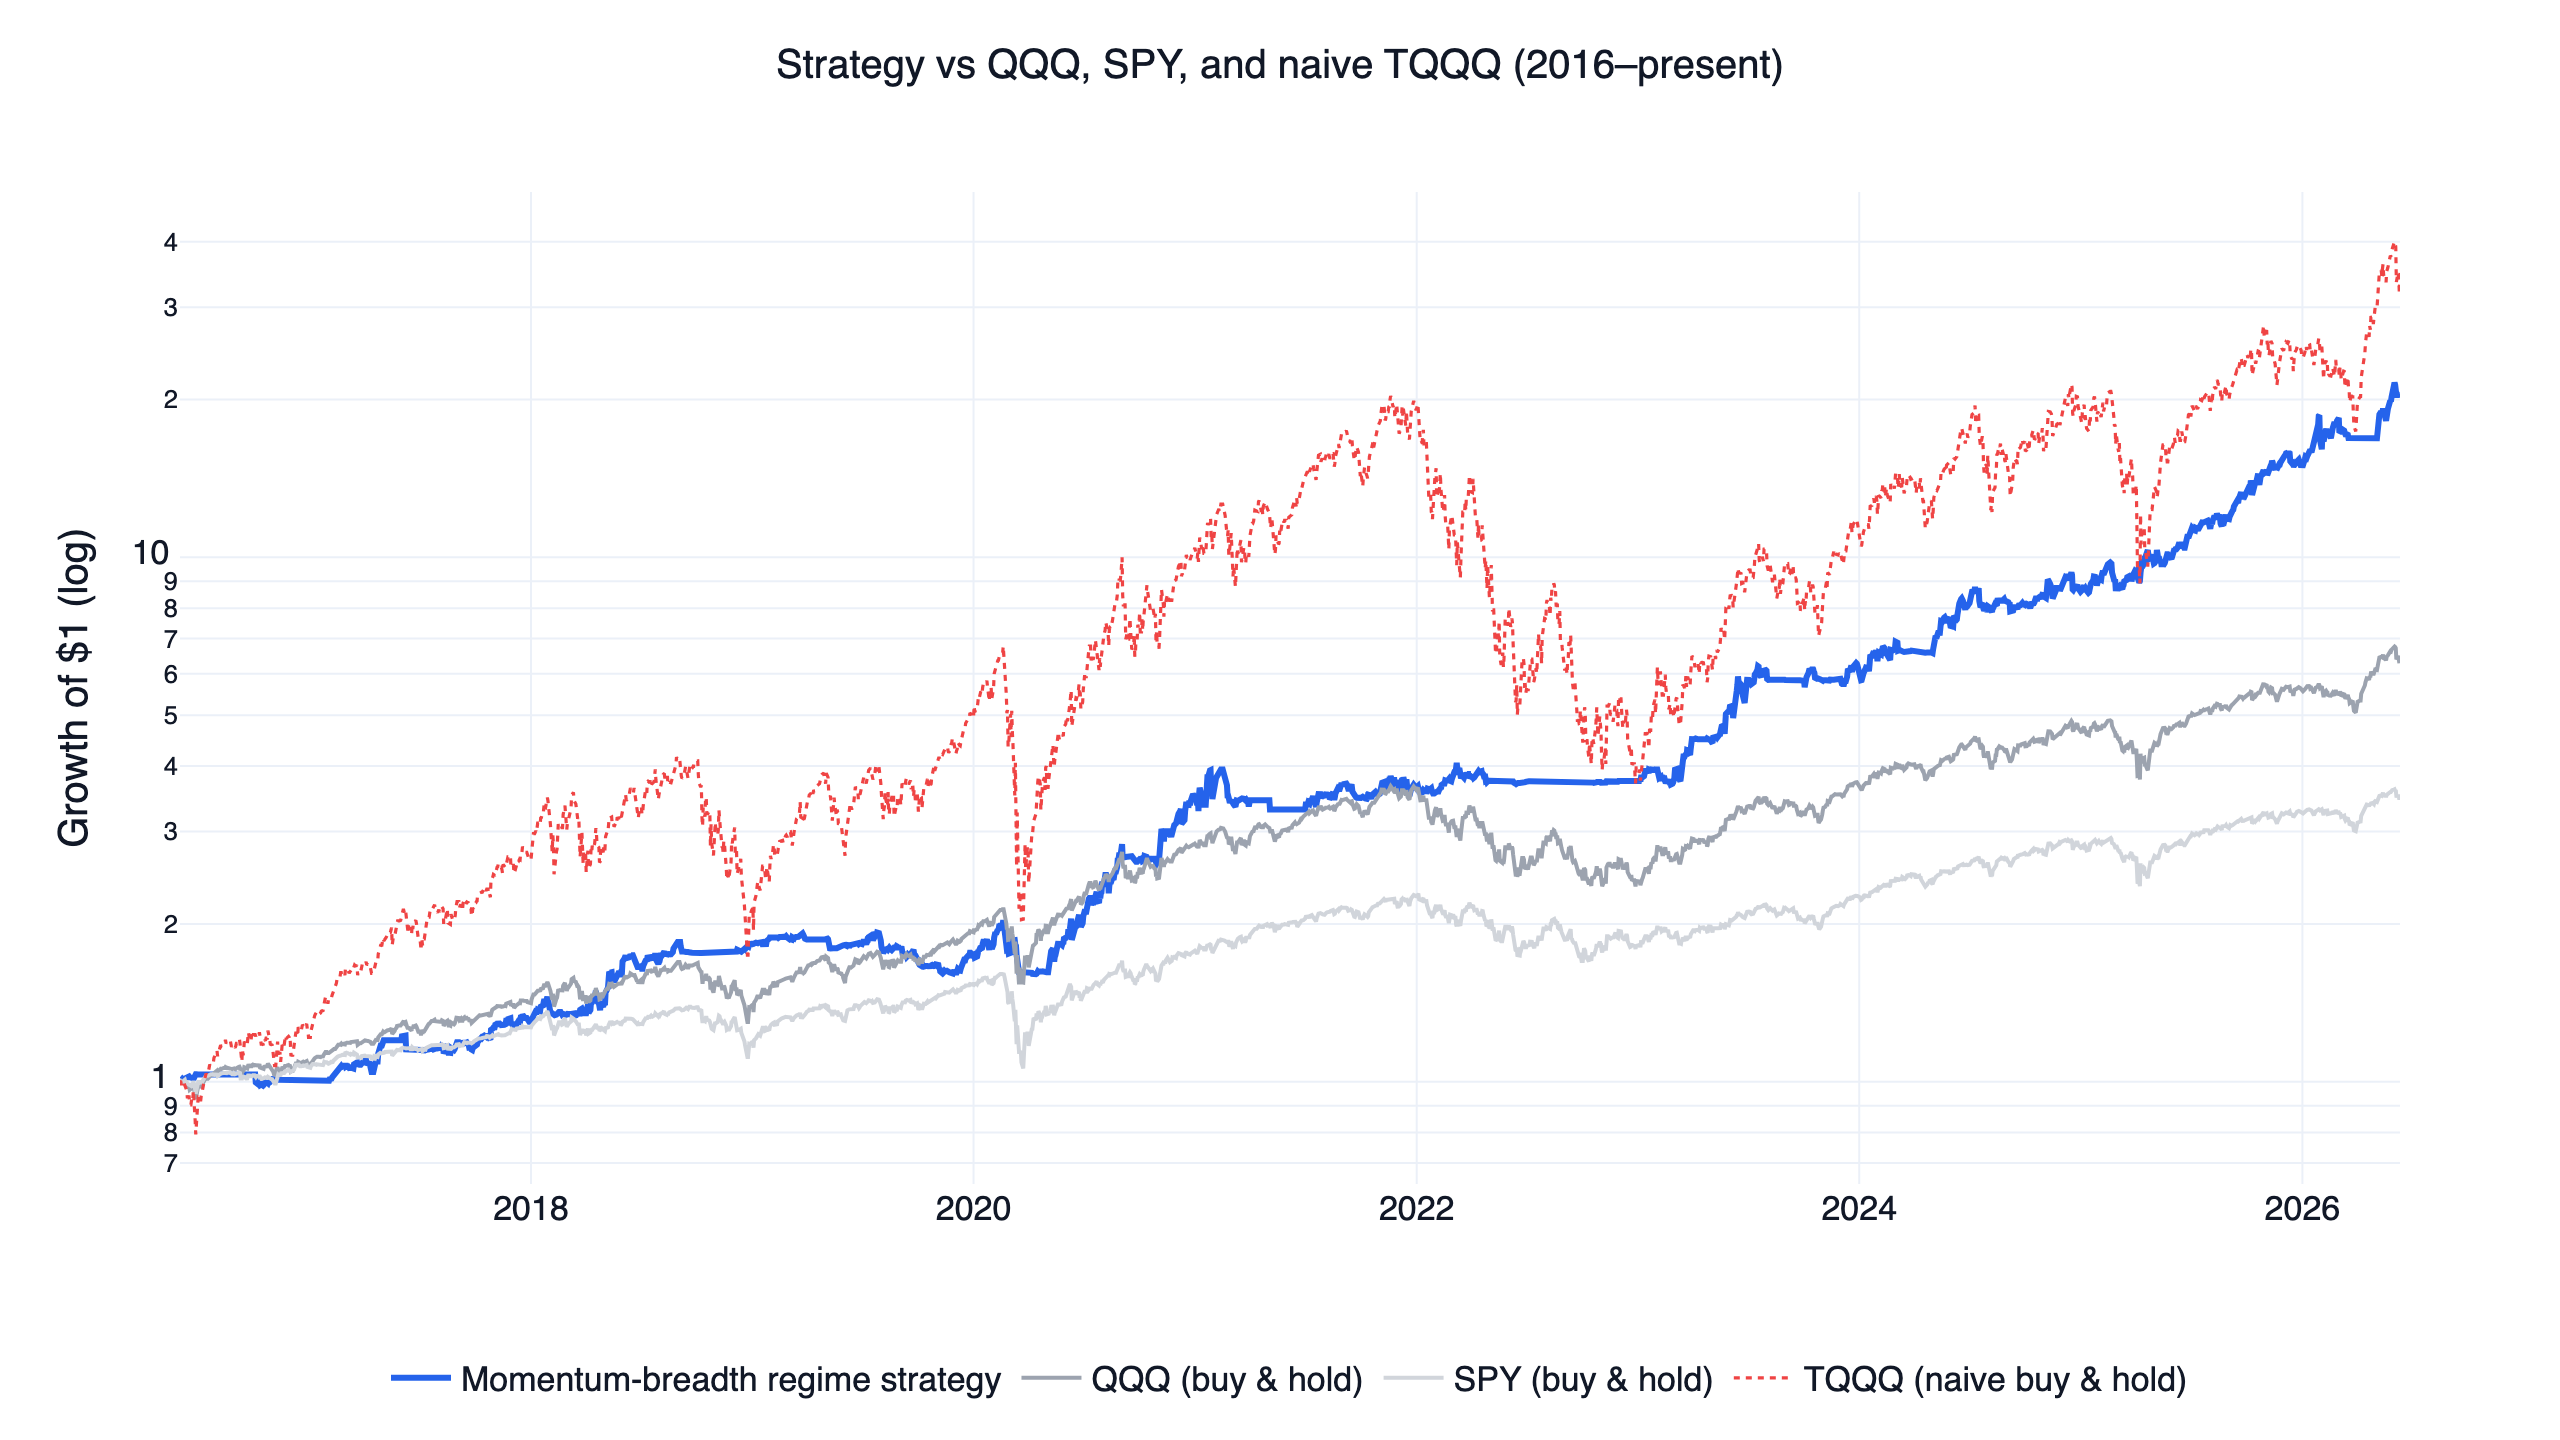
In this experiment, I used 5 prompts to have AI complete the entire workflow from "stock screening" to "backtesting" to "optimization". The final strategy achieved:
- 48.17% Annualized Return
- 1.69 Sharpe Ratio
- -30.38% Max Drawdown
In this article, I'll demonstrate 5 types of quantitative research tasks AI can perform, and share the optimization process for the final strategy.
From One Sentence to a Downloadable HTML Backtest Report
The whole loop collapses into four steps: you give one sentence of intuition, AI turns it into data conditions, finlab runs the backtest, and it outputs an interactive HTML backtest report you can open in a browser and save locally. The report carries the equity curve, annualized return, Sharpe ratio and drawdown, and every figure comes from a real backtest rather than being made up.
- One sentence: write your stock-picking intuition in plain language
- AI to conditions: AI rewrites it into data conditions
- finlab backtest: run the conditions on real Taiwan stock data
- HTML report: output a downloadable interactive HTML backtest report
Note: The following are historical backtest results and do not represent future performance.
Skill 1: Revenue New High Screening
First task: Find stocks with revenue hitting new highs.
Find stocks where the 3-month average revenue hits a 12-month high, with sufficient liquidity (20-day average volume > 500 lots)
Show Code
from finlab import data
from finlab.backtest import sim

# Get revenue and volume data
rev = data.get("monthly_revenue:當月營收")
vol = data.get("price:成交股數") / 1000  # Convert to lots

# Calculate conditions
rev_ma3 = rev.average(3)
rev_high = (rev_ma3 == rev_ma3.rolling(12).max())
vol_filter = vol.average(20) > 500

# Select stocks meeting conditions
position = rev_high & vol_filter

# Backtest
report = sim(position.loc['2015':], resample='M', position_limit=0.1, upload=False)
report.to_html('skill1_revenue_high.html')Run this strategy
Copy the prompt to reproduce the evidence above with the article’s data, assumptions, and risk checks.
Tell your AI:
Help me set up FinLab and reproduce this article. Please read: https://finlab.finance/en/setup?relatedUrl=/en/blog/ai-quant-research
Pure revenue new high achieves about 19.77% annualized. A decent start, but not good enough.
Skill 2: Institutional Flow Analysis
Second task: Find stocks with consecutive trust fund buying.
Find stocks with trust fund buying for 5 consecutive days, select top 10 by buying volume
Show Code
from finlab import data
from finlab.backtest import sim

# Get trust fund trading data
trust_net = data.get("institutional_investors_trading_summary:投信買賣超股數")
vol = data.get("price:成交股數") / 1000

# Trust fund buying for 5 consecutive days
trust_buy_5d = (trust_net > 0).sustain(5)

# Liquidity filter
vol_filter = vol.average(20) > 300

# Combine conditions
cond = trust_buy_5d & vol_filter
position = trust_net[cond].is_largest(10)

# Backtest
report = sim(position.loc['2015':], resample='M', upload=False)
report.to_html('skill2_trust_buy.html')
Trust fund strategy needs to be combined with other conditions to work effectively.
Skill 3: Technical Indicator Strategy
Third task: Build a momentum strategy with RSI and MACD.
Build a momentum strategy using RSI and MACD:
- RSI > 50 indicates bullish
- MACD golden cross
- Price above 60-day moving average
Show Code
from finlab import data
from finlab.backtest import sim

close = data.get("price:收盤價")
vol = data.get("price:成交股數") / 1000

# Technical indicators
rsi = data.indicator("RSI", timeperiod=14)
macd, macd_signal, macd_hist = data.indicator("MACD", fastperiod=12, slowperiod=26, signalperiod=9)
sma60 = close.average(60)

# Condition combinations
cond_rsi = rsi > 50
cond_macd = (macd > macd_signal) & (macd.shift() < macd_signal.shift())
cond_trend = close > sma60
vol_filter = vol.average(20) > 300

# Entry signals
cond = cond_rsi & cond_macd & cond_trend & vol_filter
position = close[cond].is_largest(20)

# Backtest
report = sim(position.loc['2015':], resample='W', upload=False)
report.to_html('skill3_technical.html')
Pure technical indicator strategy shows unstable performance, needs fundamental support.
Skill 4: Value Investing Screening
Fourth task: Find undervalued quality companies.
Find undervalued stocks: P/E < 15, Dividend Yield > 5%, ROE > 10%
Show Code
from finlab import data
from finlab.backtest import sim

# Get valuation data
pe = data.get("price_earning_ratio:本益比")
div_yield = data.get("price_earning_ratio:殖利率(%)")
roe = data.get("fundamental_features:ROE稅後")
vol = data.get("price:成交股數") / 1000

# Value screening conditions
cond_pe = (pe > 0) & (pe < 15)
cond_yield = div_yield > 5
cond_roe = roe > 10
cond_vol = vol.average(20) > 300

# Combine conditions and select stocks
cond = cond_pe & cond_yield & cond_roe & cond_vol
position = div_yield[cond].is_largest(15)

# Backtest
report = sim(position.loc['2015':], resample='M', upload=False)
report.to_html('skill4_value.html')
Value investing strategy achieves about 13.19% annualized. Stable but not exciting.
Skill 5: Consecutive Condition sustain()
This is a unique FinLab feature: sustain() detects whether conditions hold consecutively.
Show Code
# Revenue YoY growth > 10% for 3 consecutive months
rev_growth = data.get("monthly_revenue:去年同月增減(%)")
consecutive_growth = (rev_growth > 10).sustain(3)

# This is stricter than single conditions, filtering out one-time growth
This feature plays a crucial role in the ultimate strategy.
The Problem: No Single Strategy Is Good Enough
After seeing four skills, what did you notice?
| Strategy | Annualized Return | Problem |
|---|---|---|
| Revenue New High | ~20% | Doesn't filter false breakouts |
| Trust Fund Buying | Unstable | Needs fundamental support |
| Technical Indicators | Unstable | Too much noise |
| Value Investing | ~13% | Lacks momentum |
No single strategy reaches the 30%+ target.
This is where AI's true value begins...
The VIP section continues with the full AI Quantitative Research strategy: 48.2% CAGR, Sharpe 1.69, plus strategy rules, the interactive backtest, and Python code.
VIP area includes strategy details
Log in for optimization notes, source code, and the interactive report
FinLab AI
Want to build your own strategy?
Describe your stock-picking ideas in natural language. AI automatically validates, backtests, and gives you answers
Start Free