Are Three Positive Cash Flows Really Hot Stocks?
This is "common sense" many investors believe:
"Positive operating, investing, and financing cash flows = good company = hot stock"
But does data lie? Let's verify.
In the 2015-2025 Taiwan stock backtest:
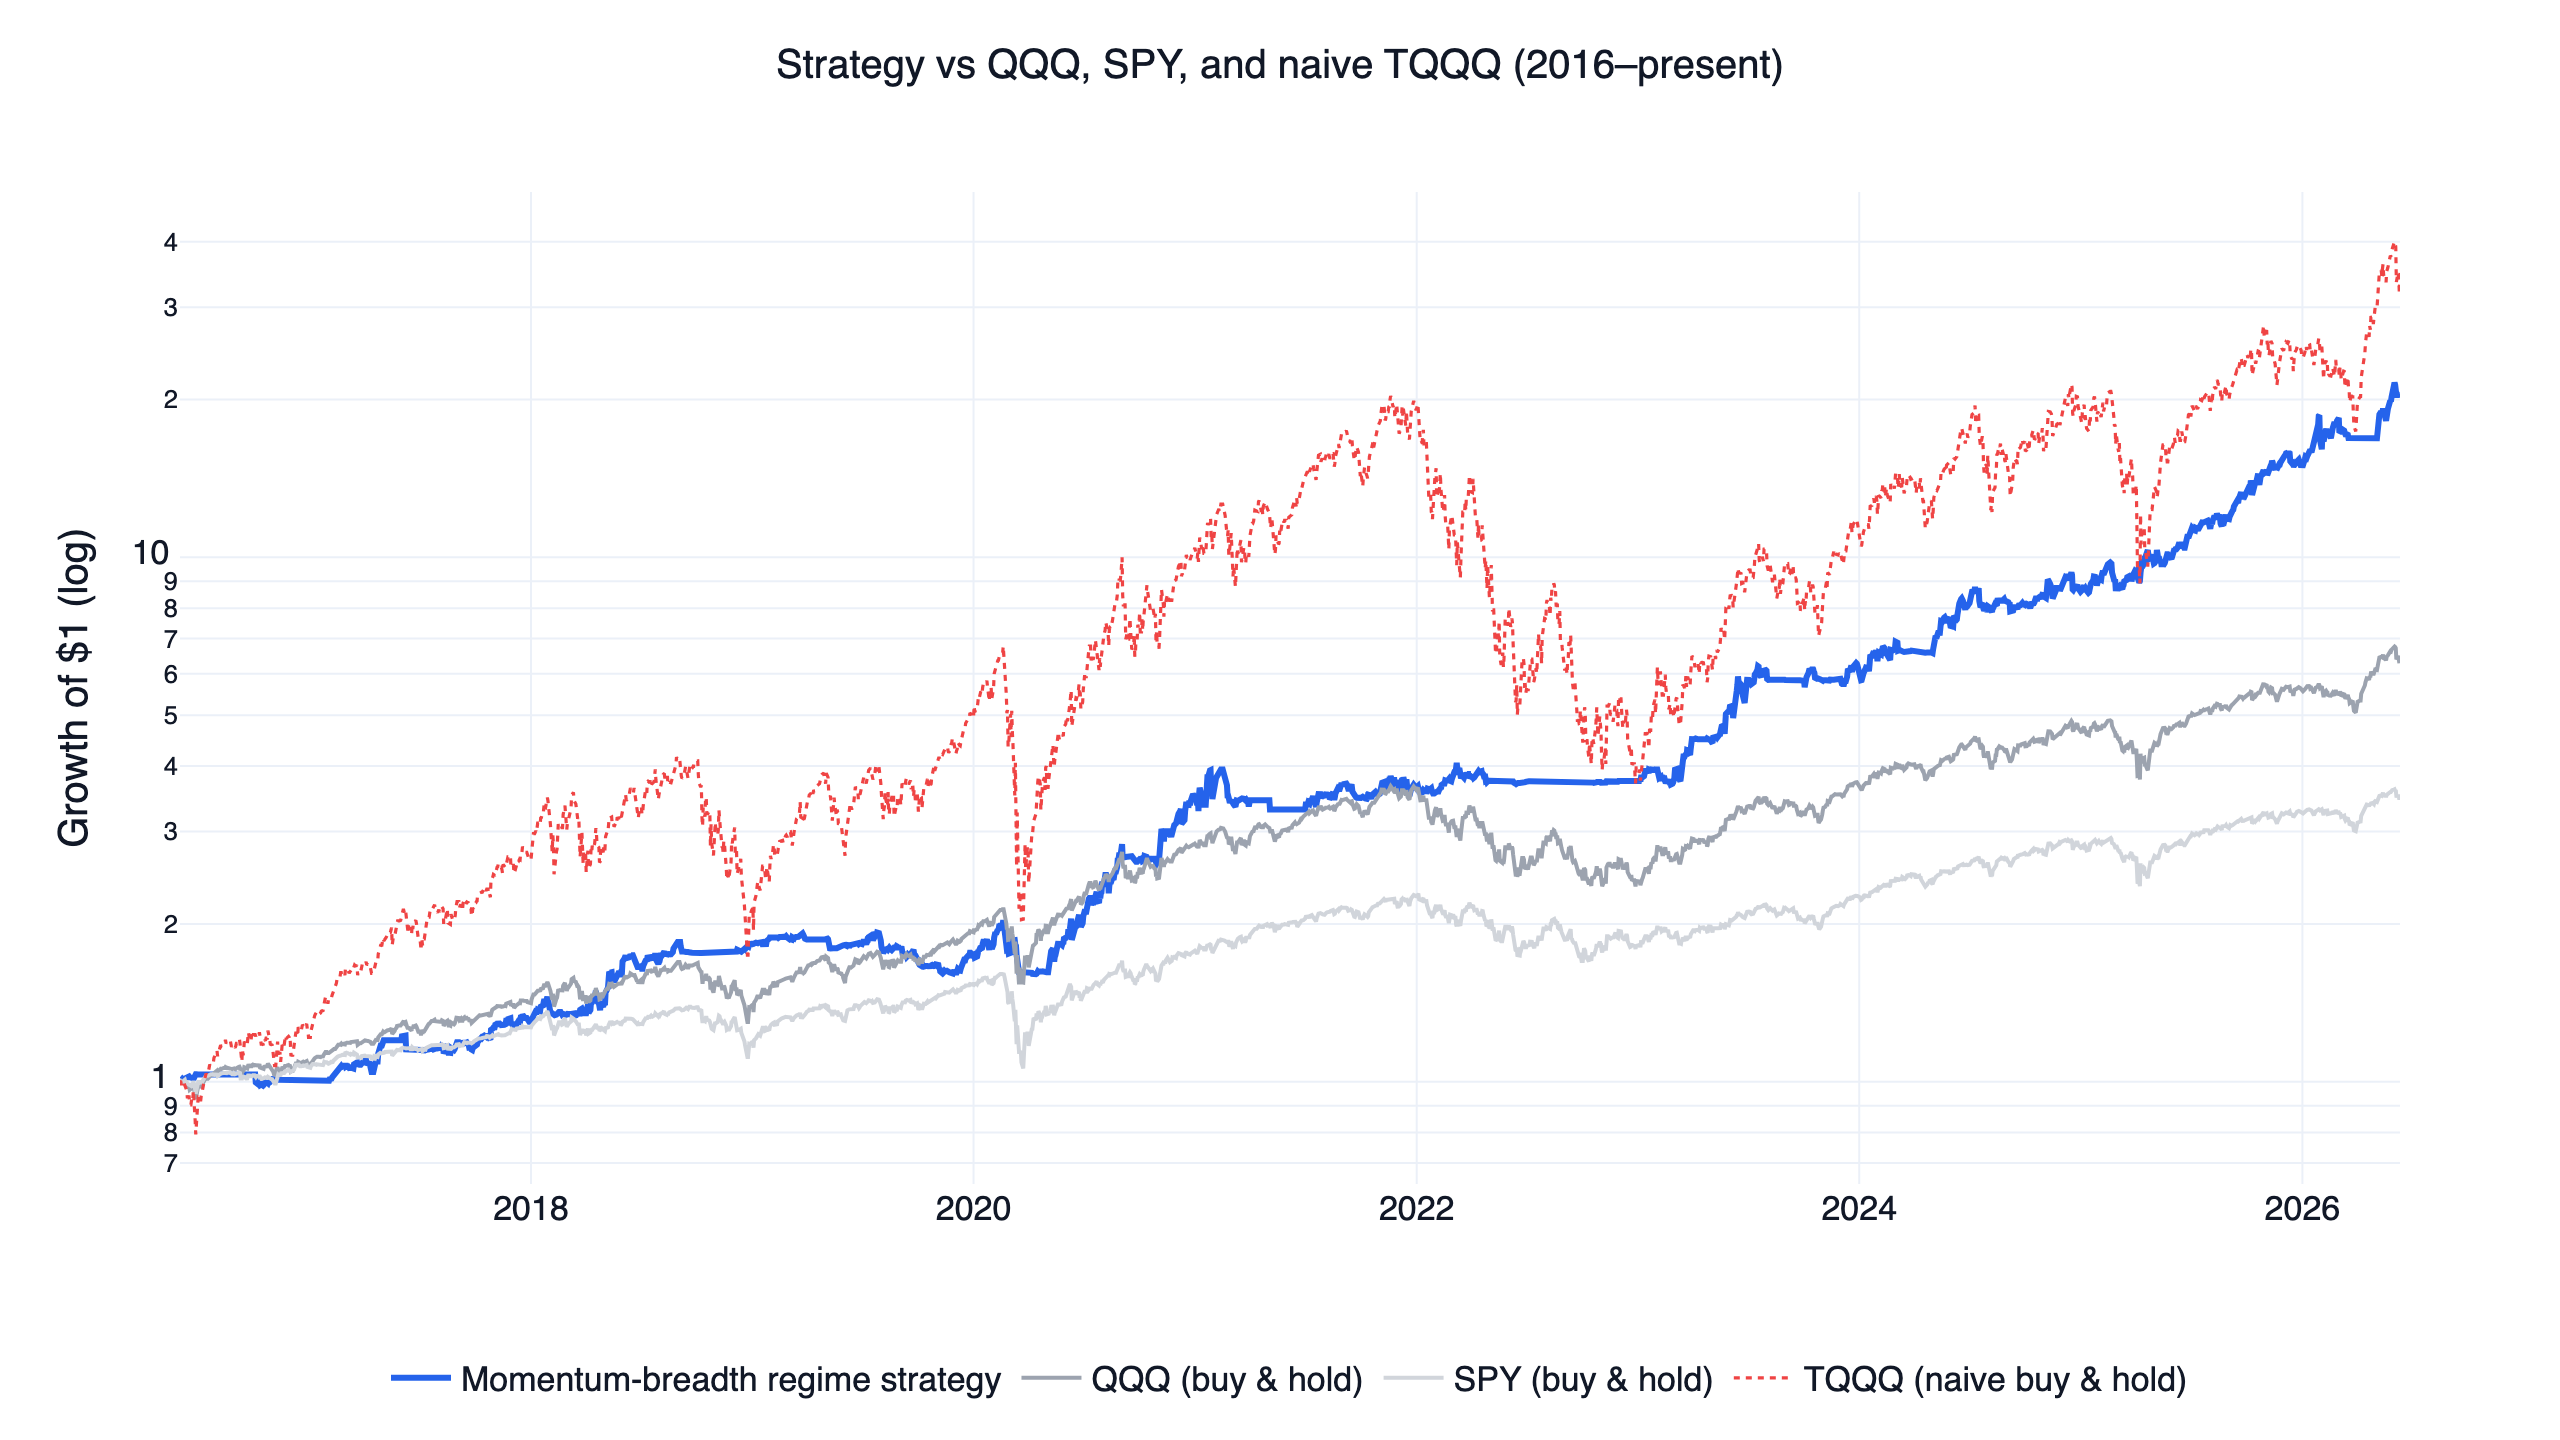
- Three All Positive Strategy CAGR: 4.61%
- Operating Positive + Investing Negative: 12.07%
- Optimized Strategy: 25.51%
Run this strategy
Copy the prompt to reproduce the evidence above with the article’s data, assumptions, and risk checks.
Tell your AI:
Help me set up FinLab and reproduce this article. Please read: https://finlab.finance/en/setup?relatedUrl=/en/blog/triple-cashflow-strategy
The result is surprising: Three all positive is actually the worst!
Note: The following are historical backtest results and do not represent future performance.
Market Phenomenon: Performance Differences Across Cash Flow Combinations
First, let's test all possible cash flow combinations:
Backtest the following cash flow strategies and compare their performance:
- All three cash flows positive
- Operating cash flow positive
- Operating positive + Investing negative
- Operating positive + Financing negative
Show Code
from finlab import data
from finlab.backtest import sim
import pandas as pd

# Get cash flow data
營業現金流 = data.get('financial_statement:營業活動之淨現金流入_流出')
投資現金流 = data.get('financial_statement:投資活動之淨現金流入_流出')
融資現金流 = data.get('financial_statement:籌資活動之淨現金流入_流出')
vol = data.get('price:成交股數')

# Liquidity filter
vol_filter = vol.average(20) > 300 * 1000

# Strategy A: All three positive
三項全正 = (營業現金流 > 0) & (投資現金流 > 0) & (融資現金流 > 0) & vol_filter

# Strategy B: Operating cash flow positive
營業正 = (營業現金流 > 0) & vol_filter

# Strategy C: Operating positive + Investing negative (growth mode)
成長股模式 = (營業現金流 > 0) & (投資現金流 < 0) & vol_filter

# Backtest comparison
results = []
for name, position in [('三項全正', 三項全正), ('營業正', 營業正), ('成長股模式', 成長股模式)]:
    report = sim(position.loc['2015':], resample='M', position_limit=0.1, upload=False)
    stats = report.get_stats()
    results.append({
        'Strategy': name,
        'CAGR': f"{stats['cagr']:.2%}",
        'Sharpe': f"{stats['monthly_sharpe']:.2f}"
    })

pd.DataFrame(results)
Shocking Discovery: Three All Positive Ranks Last!
| Strategy | Annualized Return | Sharpe Ratio | Rank |
|---|---|---|---|
| Operating+/Investing- | 12.07% | 0.58 | 1 |
| Operating Cash Flow+ | 12.03% | 0.58 | 2 |
| Operating+/Financing- | 11.69% | 0.57 | 3 |
| Free Cash Flow+ | 10.60% | 0.53 | 4 |
| Investing Cash Flow+ | 9.32% | 0.46 | 5 |
| Financing Cash Flow+ | 8.33% | 0.41 | 6 |
| Three All Positive | 4.61% | 0.23 | 7 (Last) |
Three all positive achieves only 4.61%, the worst among all strategies!
Why Is Three All Positive Actually Bad?
From a financial analysis perspective, the signs of three cash flows have different meanings:
| Cash Flow | Positive Meaning | Negative Meaning |
|---|---|---|
| Operating | Core business profitable ✓ | Core business losing ✗ |
| Investing | Selling assets/reducing investment ⚠️ | Actively investing for growth ✓ |
| Financing | Borrowing/issuing shares ⚠️ | Paying debt/dividends ✓ |
Key Insight:
- Positive Investing Cash Flow = Company is selling assets or reducing investment, may be decline signal
- Positive Financing Cash Flow = Company is borrowing or issuing shares, may be cash-strapped signal
- Three All Positive = Core business profitable, but shrinking scale and raising cash, not growth stock characteristics!
True growth stocks should be: Operating Positive + Investing Negative (profitable and actively investing in future)
Basic Strategy: Only Look at Operating Cash Flow
Since operating cash flow is most important, let's build a basic strategy:
Build an "Operating Cash Flow Positive" basic strategy:
- Entry condition: Operating cash flow positive
- Liquidity: 20-day average volume > 300 lots
- Monthly rebalancing
Show Code
from finlab import data
from finlab.backtest import sim

# Get data
營業現金流 = data.get('financial_statement:營業活動之淨現金流入_流出')
vol = data.get('price:成交股數')

# Conditions
營業正 = 營業現金流 > 0
vol_filter = vol.average(20) > 300 * 1000

# Combine
position = 營業正 & vol_filter

# Backtest
report = sim(position.loc['2015':], resample='M', position_limit=0.1, upload=False)
report.to_html('baseline_report.html')
Basic Strategy Performance
| Metric | Value |
|---|---|
| CAGR | 12.03% |
| Sharpe Ratio | 0.58 |
| Max Drawdown | -35.75% |
Average performance, but plenty of room for improvement.
The VIP section continues with the full triple cash-flow strategy: 25.5% CAGR, Sharpe 0.80, plus strategy rules, the interactive backtest, and Python code.
VIP area includes strategy details
Log in for optimization notes, source code, and the interactive report
FinLab AI
Want to build your own strategy?
Describe your stock-picking ideas in natural language. AI automatically validates, backtests, and gives you answers
Start Free